Health-GPS

Global Health Policy Simulation model
FINCH linear models, predictor encoding, and income-stratum adjustment
Global Health Policy Simulation model
| Home | Quick Start | User Guide | Schemas | Models | Architecture | Data Model | Developer Guide | Technical docs | API |
Last updated: June 2026
About this note
I put this document together for economists and modellers working on FINCH (and upcoming project) project in Health-GPS. It covers work I have recently integrated:
- Income-stratum factors-mean adjustment - optional baseline adjustment by income quintile.
- How CSV predictor names map to regression terms -
log_income,log_income2, energy intake, dummies, etc. - Questions colleagues have raised about policy equations and coefficient consistency.
gender2encoding - FINCH convention and theproject_requirements.demographics.gender2setting.
If anything is unclear or you need a walkthrough of the code path, contact Mahima :).
Related documentation
| Topic | Document |
|---|---|
| How a virtual person is modelled | How Health-GPS models a person |
| Income-stratum adjustment (implementation plan) | Income quintile factor means plan |
| 3 / 4 / 5 income categories | Dynamic income categories plan |
project_requirements schema |
Project requirements plan |
| Feb 2026 integrated changes | HealthGPS update report |
| Kevin Hall height by quintile | Height CSV quintile plan |
| Kevin Hall weight by quintile | Weight quintile plan |
| All technical docs | Technical documentation index |
| Windows MSVC / Ninja build | MSVC troubleshooting |
| Formal developer docs | developer/ |
| User docs | user/ |
| Documentation home | documentation/README.md |
Table of contents
- Overview diagram
- Income-stratum factors-mean adjustment
- Linear models and policy equations
- Predictor naming reference
- Colleague Q&A
gender2encoding- Configuration reference
- What we deliberately did not change
1. Overview diagram
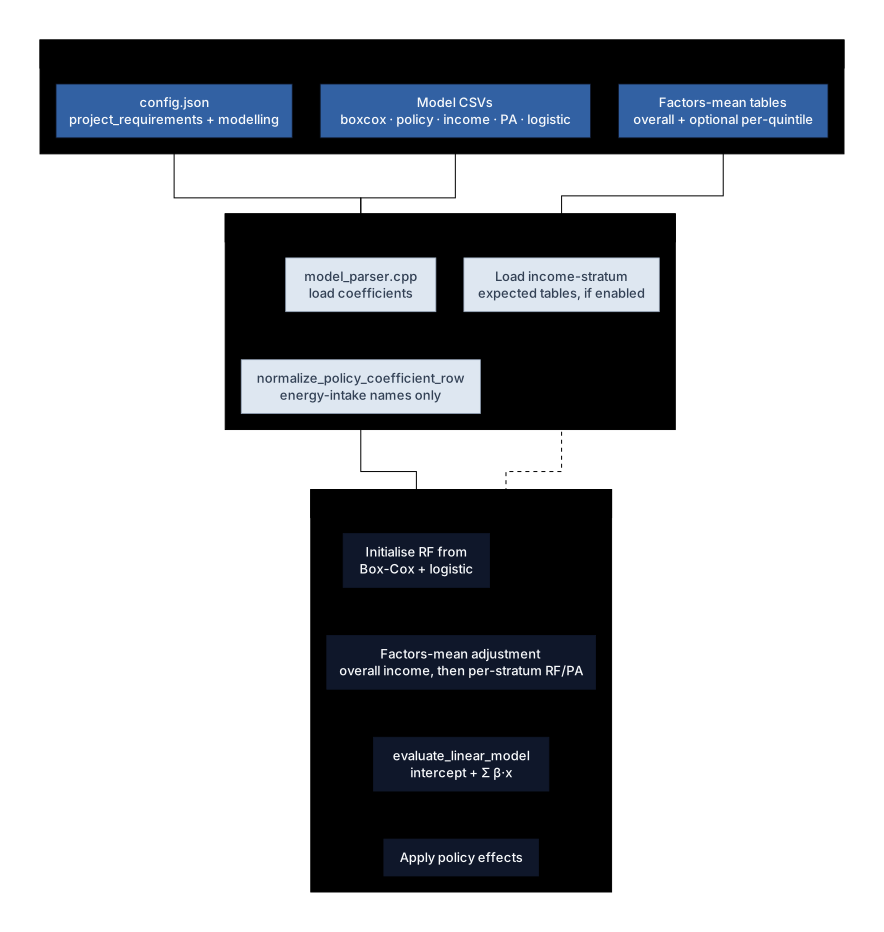
High-level picture of how FINCH static linear models, factors-mean adjustment, and predictor evaluation fit together:
 |
|---|
| Static linear modelling flow: inputs → load-time parsing → simulation steps |
2. Income-stratum factors-mean adjustment
2.1 Why we added this
For FINCH projects with continuous income, we initialise risk factors from regression models, then optionally adjust them to match expected population means (factors-mean tables by sex and age).
Previously we only had one overall pair of tables:
| File | Role |
|---|---|
Finch.FactorsMean.Male.csv |
Expected means - males |
Finch.FactorsMean.Female.csv |
Expected means - females |
Income-stratum adjustment lets us load one male/female pair per income quintile (or other rank bucket). Risk factors and physical activity are then adjusted within each stratum, using that stratum’s expected table. Income itself is still adjusted against the overall table first.
This way the virtual population can match nutrient and activity patterns conditional on income rank, not only sex and age.
2.2 Two different “income bucket” concepts - do not mix them up
| Concept | Where in config | What it does |
|---|---|---|
| Final income categories | project_requirements.income.categories ("3", "4", "5") |
Sets discrete person.income for reporting and other model logic. Assigned by equal rank split after continuous income is set. |
| Adjustment strata | modelling.baseline_adjustments.income_stratum_factors_mean |
Rank buckets used only for factors-mean adjustment. Each bucket has its own expected CSV pair. Stored as person.income_adjustment_stratum (0 … N−1). |
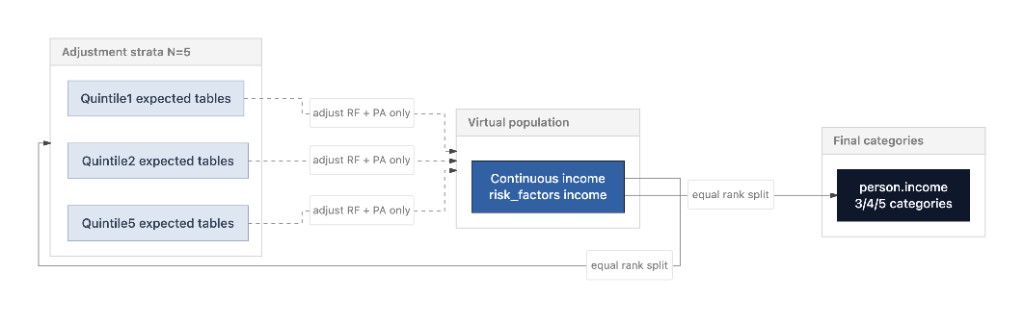
FINCH example: we use income.categories = "5" and adjustment_income_stratum_count = 5 with quintile-specific factors-mean files - five final categories and five adjustment strata, but they serve different purposes.
 |
|---|
Adjustment strata (N=5) calibrate RF + PA; equal-rank split also sets final person.income categories |
2.3 Configuration example
Under modelling.baseline_adjustments in new_config.json:
"baseline_adjustments": {
    "format": "csv",
    "delimiter": ",",
    "encoding": "ASCII",
    "file_names": {
        "factorsmean_male": "Finch.FactorsMean.Male.csv",
        "factorsmean_female": "Finch.FactorsMean.Female.csv"
    },
    "income_stratum_factors_mean": {
        "enabled": true,
        "adjustment_income_stratum_count": 5,
        "strata": [
            {
                "id": "Quintile1",
                "factorsmean_male": "Finch.FactorsMean.Male.Quintile1.csv",
                "factorsmean_female": "Finch.FactorsMean.Female.Quintile1.csv"
            }
        ]
    }
}
(Full FINCH config lists Quintile1 … Quintile5.)
2.4 Validation rules (enforced at load)
| Rule | Detail |
|---|---|
enabled = true |
adjustment_income_stratum_count must be ≥ 2 |
| Strata count | strata.length must equal adjustment_income_stratum_count |
| Each stratum | Non-empty id, factorsmean_male, factorsmean_female |
| Missing data | Missing files or risk factors → fail fast with stratum-specific errors |
enabled = false |
Legacy behaviour - overall male/female tables only |
Schema: schemas/v1/config/modelling.json → baseline_adjustments.income_stratum_factors_mean.
See also: Income quintile factor means plan (implementation phases) · Dynamic income categories plan (final person.income buckets)
2.5 Adjustment flow - what happens, in order
This path runs when all of the following are true:
project_requirements.risk_factors.adjust_to_factors_mean = trueproject_requirements.income.type = "continuous"income_stratum_factors_mean.enabled = true- At least one stratum expected table loaded successfully
Step-by-step (initial generation)
Read this top to bottom. Each step finishes before the next one starts.
| Step | What happens | Which expected table? | Who is affected? |
|---|---|---|---|
| 1 | Generate starting risk factors (nutrients, etc.) from Box-Cox / logistic / regression models | - (model CSVs only) | Whole population |
| 2 | Adjust income only | Overall Finch.FactorsMean.Male.csv / Female.csv |
Whole population |
| 3 | Sort everyone by continuous income and split into N equal rank buckets (e.g. 5 quintiles). Each person gets income_adjustment_stratum = 0, 1, …, N−1 |
- | Whole population |
| 4a | Adjust risk factors (all nutrients - not income, not physical activity) | Quintile 1 male/female tables | Only people in stratum 0 |
| 4b | Adjust physical activity (if enabled in config) | Quintile 1 male/female tables | Only people in stratum 0 |
| 5a | Same as 4a | Quintile 2 tables | Only people in stratum 1 |
| 5b | Same as 4b | Quintile 2 tables | Only people in stratum 1 |
| … | Repeat for quintiles 3, 4, 5 (or however many strata you configured) | Per-quintile tables | One stratum at a time |
| Last | Assign final income categories (3, 4, or 5 groups per income.categories) |
- | Whole population |
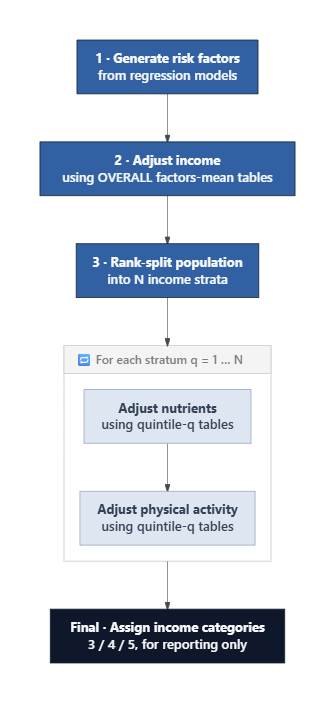
In plain terms: income is calibrated to the national expected table first; then nutrients and PA are calibrated separately within each income quintile, using that quintile’s own factors-mean files.
Small example (N = 5 quintiles)
Suppose after step 2 we have 1,000 people and continuous income is spread across the population.
Step 3 - split by income rank:
  Stratum 0 (Quintile1): lowest 200 people   use Finch.FactorsMean.*.Quintile1.csv
  Stratum 1 (Quintile2): next 200 people     use Finch.FactorsMean.*.Quintile2.csv
  Stratum 2 (Quintile3): middle 200          use Finch.FactorsMean.*.Quintile3.csv
  Stratum 3 (Quintile4): next 200            use Finch.FactorsMean.*.Quintile4.csv
  Stratum 4 (Quintile5): highest 200         use Finch.FactorsMean.*.Quintile5.csv

Step 4-5 - for Quintile1 only:
  Adjust FoodCarbohydrate, FoodFat, … (not income, not PA) to match Quintile1 expected means by sex/age

Step 4-5 - for Quintile2 only:
  Same nutrients, but now using Quintile2 expected means
  … and so on for Quintile3, 4, 5
 |
|---|
| FINCH income-stratum adjustment order: overall income, then per-stratum RF/PA |
Yearly updates follow the same ordering for non-trended adjustment; trended paths mirror this with the relevant trended flags.
Design choices we locked in:
| Choice | Rationale |
|---|---|
| Income overall table only | Stratum tables are for conditional RF/PA means, not re-defining income |
| RF + PA per-stratum tables | Match observed patterns within income rank |
| Recompute strata each step | Newborns and income changes stay in the correct bucket |
Filter by income_adjustment_stratum |
Only people in stratum k are adjusted in pass k |
2.6 Related project_requirements flags
| Field | Effect |
|---|---|
risk_factors.adjust_to_factors_mean |
Master switch for any factors-mean adjustment |
income.adjust_to_factors_mean |
Step 2 - overall income adjustment |
income.trended |
Trended income adjustment in yearly trended path |
physical_activity.enabled |
Whether PA is in the model |
physical_activity.adjust_to_factors_mean |
Per-stratum PA adjustment |
physical_activity.trended |
Trended PA adjustment |
2.7 Debug output
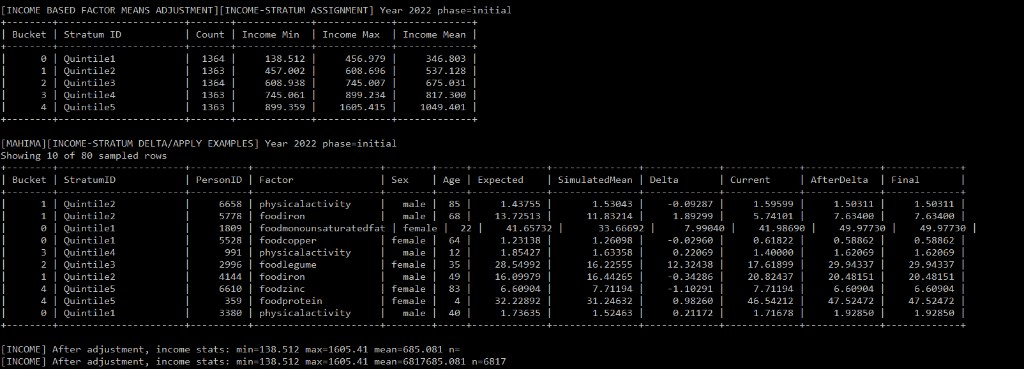
When verbosity allows, the simulation prints an income-stratum assignment table at start year and start year + 1 (count, min/max/mean income per bucket, stratum id). Search logs for:
[INCOME BASED FACTOR MEANS ADJUSTMENT][INCOME-STRATUM ASSIGNMENT]
Example console output (assignment table plus sampled delta/apply rows):
 |
|---|
| Income-stratum assignment buckets and sampled factor delta/apply rows (initial year) |
Related lines may also include [MAHIMA][INCOME-STRATUM DELTA/APPLY EXAMPLES] and post-adjustment [INCOME] stats.
3. Linear models and policy equations
This section explains the maths in plain language. You do not need to read C++ to follow it.
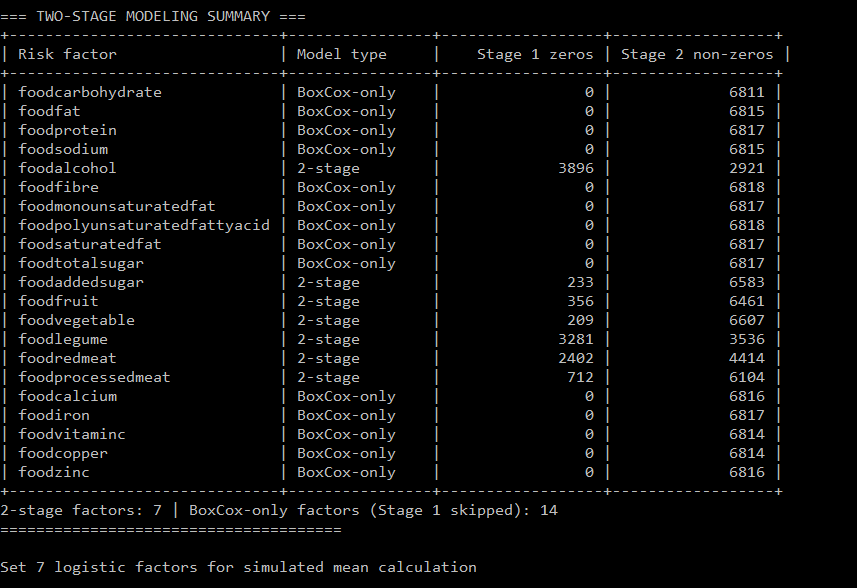
At startup the Console also prints a two-stage modelling summary: which risk factors use Box-Cox-only vs 2-stage (logistic zeros + continuous non-zeros), and the Stage 1 / Stage 2 person counts. Search logs for:
=== TWO-STAGE MODELING SUMMARY ===
 |
|---|
| Two-stage vs BoxCox-only factors and Stage 1 / Stage 2 counts |
3.1 Box-Cox risk-factor model (how a nutrient is generated)
Each nutrient (e.g. FoodCarbohydrate) goes through two stages.
Stage A - build a linear score Z
Add up the intercept and every predictor × its coefficient from the Box-Cox CSV:
Z = intercept
  + (coef_gender2  × gender2)
  + (coef_age1     × age)
  + (coef_age2     × age²)
  + (coef_log_income × log(income))
  + … other predictors …
Stage B - transform Z back to the nutrient scale Y
Each nutrient has a lambda value in the CSV (row named lambda). Then:
| If lambda!= 0 | If lambda = 0 |
|---|---|
Y = (Z^lambda - 1) / lambda |
Y = exp(Z) |
Worked intuition: the regression was fit on a transformed scale; the code computes Z exactly like the regression linear part, then reverses the Box-Cox transform to get the actual nutrient value stored on the person.
3.2 Policy effect equation (same structure as your spreadsheets)
Policy CSVs use the same linear part on the Box-Cox scale. For nutrient i (a column in the CSV):
Z_i = Intercept
    + β_gender2    × gender2
    + β_age1       × age
    + β_age2       × age²
    + β_log_income × log(income)
    + β_log_income2 × (log(income))²
    + β_region2    × (1 if region 2, else 0)
    + β_region3    × (1 if region 3, else 0)
    + … etc …
    + β_log_energy × log(EnergyIntake)
How the CSV maps to this:
| In the CSV file | Meaning |
|---|---|
Column (e.g. FoodCarbohydrate) |
The nutrient i - one equation per column |
Row (e.g. gender2, log_income) |
A predictor - one term in the sum |
| Cell at (row, column) | The coefficient β for that predictor × that nutrient |
Coefficients are read directly from the CSV. The code does not re-estimate or rescale them. They only work correctly if predictor values match how the regression was coded (Sections 4 and 6).
3.3 How the code adds up the linear part
In code, the linear score is:
linear = intercept
       + sum of (coefficient[j] × predictor_value[j])   for each row j in the CSV
Special cases:
- Rows named
log_income,log_EnergyIntake, etc. the code computes log of the underlying variable before multiplying by β. - Rows named
min,max,stddev,lambdastored for bounds/transforms, not added into the linear sum.
Example for one person and one nutrient:
| Predictor row | Coefficient (from CSV) | Person value | Term added |
|---|---|---|---|
| Intercept | 17.99 | 1 (implicit) | 17.99 |
| gender2 | 0.062 | 0 (male) | 0 |
| log_income | 8.36 | log e(25083) =10.13 | 8.36 × 10.13 =84.7 |
| … | … | … | … |
| Sum | Z for that nutrient |
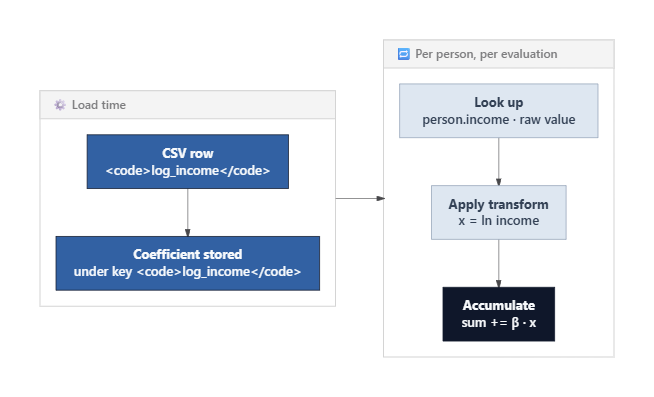
 |
|---|
How a log_income CSV row becomes a term in the linear sum |
 |
|---|
Load time stores the coefficient; evaluation looks up income, applies ln, and accumulates β·x |
3.4 Code locations (for Mahima / developers)
| Step | File |
|---|---|
| Load CSV | model_parser.cpp |
| Evaluate linear sum | linear_model_evaluator.cpp |
| Resolve predictors | predictor_resolver.cpp |
| Box-Cox + adjustment + policies | static_linear_model.cpp |
4. Predictor naming reference
4.1 Income and log-income
| CSV row name | What the code plugs in | Example (income = 20,000) |
|---|---|---|
income |
income on the person | 20,000 |
income2 |
income² (levels, not log) | 400,000,000 |
log_income |
log(income) | 9.90 |
log_income2 |
(log(income))² - not log(income²) | 98.0 |
Critical rule - read the prefix:
| Name | Means | Does not mean |
|---|---|---|
income2 |
income × income | - |
log_income2 |
log(income) × log(income) | log(income × income) |
4.2 Age
| CSV row | What the code plugs in |
|---|---|
age, age1, Age |
age (optionally capped by max_age_for_linear_models) |
age2, Age2 |
age × age |
age3, … |
age raised to that power |
4.3 Region and ethnicity dummies
| CSV row | Value |
|---|---|
region2, region3, region4 |
1 if person in that region category, else 0 |
ethnicity2, ethnicity3, ethnicity4 |
Same for ethnicity |
Reference category = omitted level (typically region1 / ethnicity1).
4.4 Energy intake in policy CSVs
normalize_policy_coefficient_row() only renames energy-intake rows:
| CSV row name | After load | What gets plugged in |
|---|---|---|
EnergyIntake |
log_energy_intake |
log(EnergyIntake) |
log_EnergyIntake |
log_energy_intake |
log(EnergyIntake) |
log_energy_intake |
log_energy_intake |
log(EnergyIntake) |
Switching from legacy EnergyIntake to log_EnergyIntake in scenario files (e.g. S1_policyeffect_model.csv) should not cause errors - both are equivalent after normalization.
This function does not create or rename log_income; that name comes straight from the CSV.
4.5 Metadata rows (not predictors)
| Row names | Role |
|---|---|
min, max, stddev, lambda |
Model bounds / dispersion - not summed in the linear predictor |
5. Colleague Q&A
Questions economists on the project have asked, with the answers we agreed on.
Q1: Why doesn’t normalize_policy_coefficient_row() mention log_income?
Answer: log_income is not created by normalization. It is a literal row name in the policy CSV. The loader stores the coefficient; at evaluation the code computes log(income) when the row name starts with log_.
Normalization is only for energy-intake naming (Section 4.4).
Q2: New policy files use log_EnergyIntake instead of EnergyIntake - will that error?
Answer: No. Both map to log_energy_intake and the code plugs in log(EnergyIntake). The newer name is clearer; we are fine using it in new scenario files.
Q3: Is the policy model “BoxCox(Y) = β₀ + β₁ X₁ + …” consistent with the code?
Answer: Yes.
| Your notation | Code |
|---|---|
| Columns = nutrients | Risk factor identifiers |
| Rows = predictors | Coefficient map keys |
| β in each cell | coefficients[predictor] for that nutrient |
| Box-Cox transform | Applied after the linear sum Z is computed |
Coefficients are not altered at load (except energy-intake renaming, not sign/magnitude changes).
Q4: Should log_income be log(income) and log_income2 be log(income) × log(income)?
Answer: Yes.
| CSV name | Code plugs in |
|---|---|
log_income |
log(income) |
log_income2 |
log(income) × log(income) |
income2 |
income × income (not logged) |
Q5: Should gender2 be male = 0 and female = 1?
Answer: For FINCH, yes. That matches how the regressions were estimated and how factors-mean files encode sex (Gender column: 0 = male, 1 = female in Finch.FactorsMean.*.csv).
On main before the gender2 config fix, the integrated code incorrectly used male = 1, female = 0 for the gender2 CSV row. That applied the sex coefficient to the wrong people. Negating all gender2 coefficients is not a valid fix.
After the fix, set in config:
"gender2": "female"
so female = 1 and male = 0 for the gender2 row. If omitted, default is "male" (backward compatibility for non-FINCH projects).
Q6: Was it correct before the integrated codebase? Are main-branch FINCH runs wrong?
Answer: FINCH data convention (female = 1) did not change. The regression evaluation for the gender2 row was wrong on main until project_requirements.demographics.gender2 was wired through. FINCH simulations on main before that fix should be treated as incorrect for the sex term unless they ran on a branch with the fix.
Internally each person still has male / female as an enum - only the dummy for the gender2 CSV row is configurable.
Q7: Can we use gender_to_value() to get female = 1 for FINCH?
Answer: Not for the gender2 row. gender_to_value() still returns male = 1, female = 0 (used for legacy Gender predictors, e.g. India). The gender2 row uses gender2_regression_value() and the gender2 config (Section 6).
6. gender2 encoding
6.1 FINCH convention
| Sex | gender2 in regression |
Gender in factors-mean CSV |
|---|---|---|
| Male | 0 | 0 |
| Female | 1 | 1 |
Dummy form (FINCH, after fix with "gender2": "female"):
gender2 = 1  if person is female
gender2 = 0  if person is male
Contribution to the linear sum: coef_gender2 × gender2
6.2 Configuration
"project_requirements": {
    "demographics": {
        "gender2": "female"
    }
}
| Config value | Meaning |
|---|---|
"female" |
gender2 = 1 for females, 0 for males (FINCH) |
"male" |
gender2 = 1 for males, 0 for females (default if omitted) |
Schema: schemas/v1/config/project_requirements.json.
See also: Project requirements plan
6.3 How gender2 is computed (plain logic)
1. Read config:  project_requirements.demographics.gender2  →  "female" or "male"
2. That setting means: which sex gets the value 1 for the gender2 row
3. For each person:
     if person.sex matches the configured indicator  →  gender2 = 1
     else                                            →  gender2 = 0
4. Add to linear sum:  coef_gender2 × gender2
Config gender2 |
Female person | Male person |
|---|---|---|
"female" (FINCH) |
gender2 = 1 | gender2 = 0 |
"male" (default) |
gender2 = 0 | gender2 = 1 |
6.4 Which FINCH files use gender2
| File | Contains gender2 row |
|---|---|
boxcox_coefficients.csv |
Yes |
policyeffect_model.csv / S1_policyeffect_model.csv … |
Yes |
logistic_regression.csv |
Yes |
income_model.csv |
Yes |
physicalactivity_model.csv |
Yes |
India-style models using a Gender JSON key (not gender2) are unchanged.
7. Configuration reference
7.1 FINCH new_config.json (key excerpt)
{
    "project_requirements": {
        "demographics": {
            "age": true,
            "gender": true,
            "region": true,
            "ethnicity": true,
            "max_age_for_linear_models": 80,
            "gender2": "female"
        },
        "income": {
            "enabled": true,
            "type": "continuous",
            "categories": "4",
            "adjust_to_factors_mean": true
        },
        "physical_activity": {
            "enabled": true,
            "type": "continuous",
            "adjust_to_factors_mean": true
        },
        "risk_factors": {
            "adjust_to_factors_mean": true
        }
    },
    "modelling": {
        "baseline_adjustments": {
            "income_stratum_factors_mean": {
                "enabled": true,
                "adjustment_income_stratum_count": 5,
                "strata": [
                    { "id": "Quintile1", "factorsmean_male": "...", "factorsmean_female": "..." }
                ]
            }
        }
    }
}
7.2 Checklist before running FINCH with new features
| Check | |
|---|---|
income.type = "continuous" |
|
risk_factors.adjust_to_factors_mean = true |
|
demographics.gender2 = "female" for FINCH |
|
If using strata: enabled = true, count = strata length x 2 |
|
| Quintile CSV pairs exist for each stratum id | |
| Policy CSV predictor names match Section 4 |
8. What we deliberately did not change
| Item | Status |
|---|---|
| CSV coefficient values | No sign flips or re-estimation |
Internal person sex (male / female enum) |
Unchanged |
gender_to_value() for legacy Gender predictor |
Still male = 1 (e.g. India) |
| Disease logic, demographics, other predictors | Unchanged |
Legacy path when income_stratum_factors_mean.enabled = false |
Same as before |
Default when gender2 omitted |
"male" (male = 1) for backward compatibility |
Questions?
For implementation detail, debugging, or config help, please contact Mahima Ghosh.
Useful source files:
| Topic | Location |
|---|---|
| Income stratum adjustment | src/HealthGPS/static_linear_model.cpp, risk_factor_adjustable_model.cpp |
| Config parsing | src/HealthGPS.Input/model_parser.cpp, configuration_parsing.cpp |
| Linear evaluation | src/HealthGPS/linear_model_evaluator.cpp |
| Predictors | src/HealthGPS/predictor_resolver.cpp |
| Schema | schemas/v1/config/modelling.json, project_requirements.json |
| FINCH example | input-data/data/KevinHall_FINCH/new_config.json |
| Tests | IncomeStratumAdjustment.Test.cpp, PredictorResolver.Test.cpp |
June 2026 - income-stratum adjustment and demographics.gender2 on the Health-GPS development branch.
Technical documentation index · Documentation index
Author: Mahima Ghosh